Air
The Air model calculates the NO2, PM10, PM25 and EC concentration emitted by traffic. It uses the Dutch SRM1 and SRM2 (standardized calculation methods) as described in the RBL 2007 (Dutch regulation for air quality).
Air quality in cities is substantially determined by emissions of air pollutants by road traffic vehicles. Two components that are usually quantified in order to indicate local air quality are particulate matter and nitrogen dioxide. Particulate matter (PM) is an air pollutant that has a negative influence on human health [7][8]. NO2 is an indicator of combustion exhaust [8]. For PM10 as well as NO2, EU limit values are set for yearly average concentrations, as well as for 8 hour and 24 hour averages respectively.
In Urban Strategy, local air quality is modeled by combining the national background levels of PM10 and NO2 with the contributions of local streets and highways. The SRM1 calculation methods are to calculate the local contribution. In the SRM1 method, emission of road traffic is determined on the basis of traffic volume, vehicle classes, speed classes and congestion [10]. In this model, dispersion of air pollutants in the street are calculated on the basis of configuration classes of the so-called street canyons.
Emissions and dispersion around highways are calculated with the 'pluim-snelweg' (PSW) model or SRM2 method. This model uses the same vehicle categories as SRM1, but has more speed and congestion classes [11]. Dispersion is calculated across a longer range than in the SRM1 model and local meteorological profiles are used [12].
Emission values as well as background concentrations change over time. Because of type approval regulations and the introduction of PM filters, emission values are becoming smaller and smaller. Because of this, and similar actions on other emitters, background values are likely to decrease as well. Therefore, emission and background scenarios are implemented. On the basis of the year in which developments are planned, appropriate emission factors and background values are taken from the database. These emission values are updated annually.
Results of air quality calculations are emission values on receptor point, concentration contours and maps that indicate the areas where limit values are exceeded.
Overview of computation methods
The roadtype determines whether the SRM1 or SRM2 method is used. We distinguish road within and outside the build environment.
Urban roads are roads in cities, roads with buildings within 30 or 60 meters (perpendicular distance), so the maximum calculation distance is the distance to facade. Urban roads are also roads without a height difference with the surroundings and roads without shielding structures.
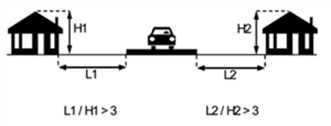
Non-urban roads are road for which the distance between the roads and buildings is at least three times higher than the height of the buildings. For urban roads the SRM1 method is used, for the non-urban roads SRM2. If the roadtype is not named in the data store, the calculation method is based on the speed of the road: SRM2 for speeds higher than 70 km/h and SRM1 for speeds lower than 70 km/h.
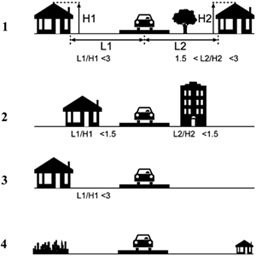
Roads used in SRM1 calculations
The figure shows the types of roads used in the SRM1 calculation. The road type is automatically determined based on the geometry of the buildings in the surroundings. In the SRM1 calculation the concentration is calculated at receptors up to 30 to 60 meters perpendicular to the road and with interval of 10 meters parallel to the road. The concentration can be compared with limit value’s from 10 meters onwards, unless distance between the roads and building is shorter. In the last case the concentration can be compared with limit value’s on the facade of the building. For more details on the actual calculations, you can contact TNO.
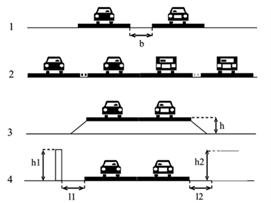
Roads used in SRM2 calculations
A few examples of the non-urban roadtypes used in the SRM2 calculation is shown in the figure. The SRM2 calculations add the contributions of all road sections in a radius of 5km around the receptor. The receptors are placed in a global 10x10 meter grid. The concentrations can be compared with limit value’s from 10 meters perpendicular to the road. For more details on the actual calculations, you can contact TNO.
Input data - fixed
The air model uses several types of information that are fixed for a given year. An overview of this data is provided below.
Emission of road traffic
The emission factor used depends on the vehicle types and speed types. The vehicle types that are used are:
- Light vehicles (passenger cars) [<3.5 ton]
- Medium heavy vehicles (light trucks) [3.5-20 ton]
- Heavy vehicles (heavy trucks) [> 20 ton]
- Busses
The speeds that are used are:
- City traffic
- City normal
- City fast
- Buitenweg
- Highway average (with or without limited speed by trajectory control)
In addition to an emission factor for passing traffic, there is also an emission factor for the time that the car is in a traffic jam. This factor is independent of the speed driven but is dependent on the vehicle type.
Wind speed (SRM1 calculations)
The annual average concentration contribution at a certain location next to a road depends, on the average wind speed at this location. To calculate the dilution of the SRM1 contribution from an urban road, a 1 km X 1 km map with a wind speed interpolated between Schiphol and Eindhoven is used.
Wind compass rose (SRM2 calculations)
In addition to the direct NO2 emissions, there is also a part that is formed by the reaction of NO with Ozone. The Ozone concentrations depend on the wind direction. For the correction of the amount of NO2 as a result of the conversion by O3, there are still the so-called Ozon compass roses.
The Ozon compass rose consists of the map of the Netherlands divided into sections of 1 km by 1 km. For each square, for 12 winning directions (345 - 15, 15 - 45, 45 - 65, etc.) is the frequency of occurrence of this wind direction, the average wind speed and the average O3 concentration per direction.
Input data - dynamic
The table below provides an overview of model input that affects the air quality indicators, and these inputs can change depending on the interventions that are being simulated in the digital twin.
| SRM1 | SRM2 | |
|---|---|---|
| Intensity | The intensity of light vehicles (passenger cars), medium-heavy vehicles (light trucks), heavy vehicles (heavy trucks) and busses per 24 hours. | The intensity of light vehicles (passenger cars), medium-heavy vehicles (light trucks), heavy vehicles (heavy trucks) and busses per 24 hours. |
| Road type | May be entered 1, 2, 3 or 4. Otherwise a building shape with the attribute height is needed. | Indicate whether the road section is type 3 (highway) or 4 (highway with limited speed by trajectory control) |
| Speed | Information about the speed of the road. | Information about the speed of the road. |
| Congestion | Factor that corrects for part of the day with congestion. It is expressed as a percentage (e.g. 7 percent stagnation is 0.07). For traffic type 'stagnant city traffic' it is already included and therefore it should be 0. | Factor that corrects for part of the day with congestion. It is expressed as a percentage (e.g. 7 percent stagnation is 0.07). For traffic type 'stagnant city traffic' it is already included and therefore it should be 0. |
| Tunnel factor | For each road section it needs to be indicated whether it is in a tunnel, or whether it connects to a tunnel. | For each road section it needs to be indicated whether it is in a tunnel, or whether it connects to a tunnel. |
| Road height | Average height of the road in comparison to the surroundings; a value between -30 and 30 meters. | |
| Screen height | Distance (in meters) between the middle of the road and the noise screen. Up to 50 meters it affects the calculations. | |
| Screen distance | Height (in meters) of the noise screen at the left side of the road. Maximum is 6 meters. |
Output data
The output is the traffic contribution from the SRM1 and SRM2 roads combined with the background concentration. The calculation model makes it possible to perform calculations of the annual average concentrations of:
- The annual average concentrations nitrogen dioxide (NO2), particular mather PM10 and PM25.
- Other components such as lead, carbon dioxide, elemental carbon (EC) or benzene may also be present, provide the emission factors backgrounds, etc. are present.
Literature
[7] Hoek, G., B. Brunekreef, S. Goldbohm, P. Fischer, P.A. van den Brandt, “Association between mortality and indicators of traffic-related air pollution in the Netherlands: a cohort study“, The Lancet, Volume 360, Issue 9341, 19 October 2002;
[8] http://www.who.int/mediacentre/factsheets/fs313/en/index.html;
[9] Jonkers, S., “Handleiding CARII, versie 6.1” TNO rapport 2007 A-R0788/B, 2007. [in Dutch]
[10] Smit, R., Mieghem, Hensema, Rabé, Eijk, “VERSIT+ Emissiefactoren voor Standaardrekenmethode 1 (CAR II)”, TNO rapport MON-RPT-033-DTS-2007-00709, 2007, [in Dutch];
[11] Smit, R., Mieghem, Hensema, “Algemene PM10, NOx en NO2 Emissiefactoren voor Nederlandse Snelwegen”, TNO-rapport 06.OR.PT.029.1/RS, 2006 [in Dutch];
[12] Wesseling, J.P. & Zandveld, P.Y.J. (2006) Pluim Snelweg, TNO rapport 2006/A/R/00675/A, 2006 [in Dutch];