Demand
The traditional way of determining transport demand is a lengthy process. It requires various types of data, such as population data, traffic zone data and level-of-service data (travel time, cost and distance between zones). This process requires a long computation time. In an exploratory phase of a project, it is preferable to have a tool that can quickly provide a plausible understanding of the impact of different interventions on travel demand with respect to the current travel demand. Therefore, the demand model is developed as a 'quick scan' tool to meet this requirement. It helps to arrive at a number of interesting scenarios and their impact on travel demand, leading to further more detailed analysis.
The model calculates the travel demand growth of different modalities. This growth refers to the number of additional departing and arriving trips (also called production and attraction, respectively) from and to the specific traffic analysis zones. The additional trips are determined for three types of changes in the area. The first one is the extra trips generation due to increase in population, jobs or education. The second is the extra trips due to extra facilities, such as supermarkt, hotels, horeca, etc. The third type is the extra logistic trips because of new factories.
Overview of computation steps
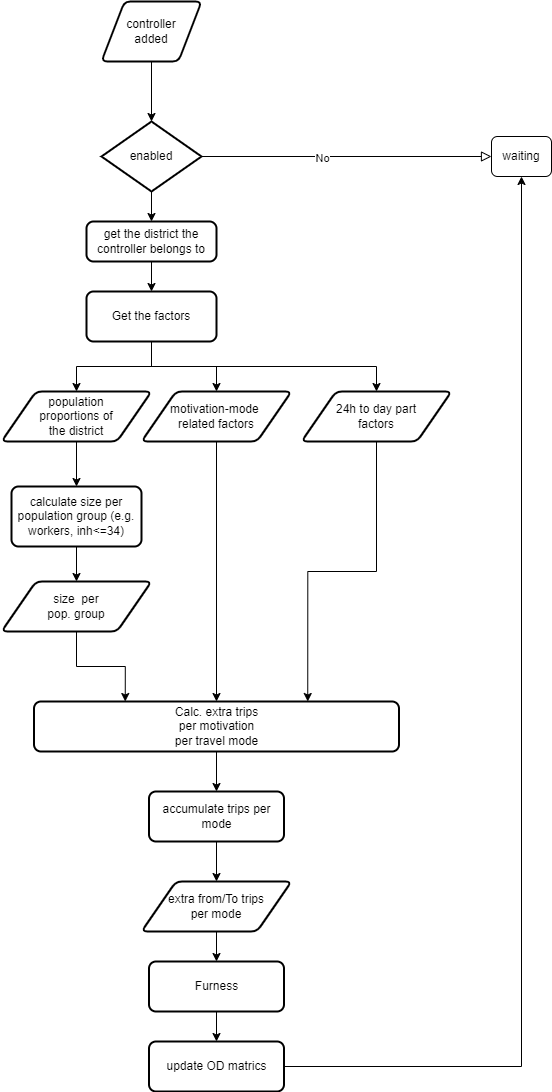
The overview below shows the steps that are used in the Demand model to calculate additional trips.
- Identify the district id where the new dwellings/jobs/schools/facilities/factories are placed.
- Identify the day part.
- Calculate the size of each user group (e.g. number of workers, population younger than 34). The user groups are corresponding to travel purpose (e.g. workers are related to home-work and work-home purpose).
- For the specific day part, read the 24h-to-daypart factor of each mode and travel purpose combination.
- Read the production and attraction factors per travel mode per travel purpose of the specified district.
- Calculate the extra production and attraction trips per mode per travel purpose in the specified day part.
- Accumulate all production and attraction trips of each mode from the specified district and specified day part.
- Furness the HB matrix per mode
- Update the HB matrices
The figure illustrates the computation steps after triggering a control (intervention) in the digital twin interface.
Calculation
In the sections below we elaborate about the computations that are used to compute the additional trips.
Additional trips by Industry
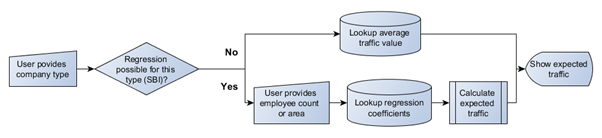
This sub-component determines the traffic production/attraction generated by a company of a certain type and size. To determine the resulting traffic, there are 3 types of calculations: A) Based on area; B) Based on employee number; C) Based on company category only. Whether type A or B is chosen depends on which category (identified with an SBI code) was chosen and which independent variable (area or employee) had the highest explained variance proportion (\(R^2\)) for that category according to literature (Iding, Brummelman, Bovenkerk, & Tavasszy, 2002). Ideally a type A or B calculation is done. Unfortunately not all categories have a sufficiently strong regression model. For those, a general traffic number is determined based on the category only (type C). A flowchart summarizing above process is shown in the figure below. After the first step (“User provides company type”), this flowchart should be repeated for the attraction and production.
From an earlier study (Iding et al., 2002) regression models are found for the traffic generation of a company based on the area, number of employees and category. In general the regression formula is:
where:
- \(y_{cat}\) - Traffic production or attraction for a category per day
- \(A\) - Total company area in \(m^2\)
- \(b_{cat}\) - Area regression coefficient for the specific category
- \(c_{cat}\) - Area regression constant for the specific category
- \(E\) - Number of employees
- \(d_{cat}\) - Employee number regression coefficient for the specific category
- \(f_{cat}\) - Employee number regression constant for the specific category
Input collections
The overview below shows which data collections should be filled when running the model.
| Collection | Description |
|---|---|
| DMND_FACTOR_24H_TO_PERIOD | factors to distribute 24h trips of a mode and purpose to different day part (normally the Morning peak, evening peak and rest of day |
| DMND_FACTOR_AREA_MODE | scale factors per district per mode to rescale the number of trips from the whole area to specific district |
| DMND_FACTOR_AREA_POPU | ratio of different population groups (defined in DMND_SOCIO_ECONOMIC_GROUPS) in each district |
| DMND_FACTOR_PURPOSE_MODE | trip production and attraction factors per mode per travel purpose |
| DMND_FACTOR_TOUR_TO_TRIPS | factors to convert number of tours to number of trips |
| DMND_FACTOR_TYPES | indicates production type (2) or attraction type (1) |
| DMND_PARKING_ELASTICITY | parking elasticity w.r.t. production or attraction per parking interventions (1 - parking lots, 2 - parking licence, 3 - parking tarif) |
| DMND_PURPOSE_SEG | indicates the travel purpose per SOCIO_ECONOMIC_GROUPS (SEG) group |
| DMND_PURPOSE_TYPES | lookup table of travel purpose |
| DMND_SOCIO_ECONOMIC_GROUPS | lookup table of SEG groups |
| TRAF_ODMATRIX.D% | For each dimension considered, you have to provide an OD matrix with trips. |
| TRAF_ZONES | Information about zones. |
| TRAF_DIMENSIONS | Information about dimensions modeled. |
| TRAF_ZONES | zones contains the district_id they belong to |
Output data
The demand model adjust the number of trips in the Origin-Destination matrices in the data store.
Parameters and settings
| Name | Value | Description |
|---|---|---|
| dayPart | select from [1, 2, 3] corresponding to "Morning peak", "Evening peak" and "Rest of day" | day part |
| processCar | True/False (default True) | calculate extra car trips |
| processTruck | True/False (default False) | calculate extra truck trips |
| processTransit | True/False (default False) | calculate extra transit trips |
| processBike | True/False (default False) | calculate extra bike trips |
| includeDeltaTrips | True/False (default False) | include delta trips as input trips per OD |
| state_group | specify which group this model belongs to, default is 1 |
Interventions
When configuring interventions (controls) in the user interface, the model and subtype should be specified. Different types of interventions are possible. The user must specify which type of intervention needs to be implemented. Most interventions require additional information to be passed in addition to a type. This differs for each type. The following table gives an overview:
Literature
- J. v. d. Elshout, M. Pieters, R. Verweij, J. Herder, A. Kwant, G. v. Eck and J. Baak, “Verkeersmodel VMA 3.0,” Gemeente Amsterdam, 2020.
- CBS, “Arbeidsdeelname:gemeenten,” 2021. [Online]. Available: https://dataportal.cbs.nl/detail/CBS/85512NED. [Accessed dec 2023].
- CBS, “Onderweg in Nederland 2021,” 2021.
- T. Maas, C. Bernards, C. Palsrok, T. v. Genderen, A. Geerts, R. Lengers and R. v. d. Honing, “Handbook Model BBMA 2022,” Provincie Noord-Brabant, 2023.
- T. Maas, C. Bernards, C. Palsrok, T. v. Genderen, A. Geerts, R. Lengers and R. v. d. Honing, Handboek Database, Provincie Noord-Brabant: Provincie Noord-Brabant, 2023.