Web Interface
This guide describes the main functionalities of the Web Interface. The Web Interface is an interactive visualization layer that enables (temporary) changes to various data elements. This includes, for example, building homes, introducing parking fees, or changing the speed limit on a specific road. The impact of these interventions is then displayed in various indicators on the Web Interface. In this way, numerous combinations of measures can be explored interactively.
This guide is broken down into four main sections, each representing a quadrant of the main UI layout as seen in Figure 1 below. The tools and functionality found in each quadrant will be described in their related quadrant, as listed in the left menu.
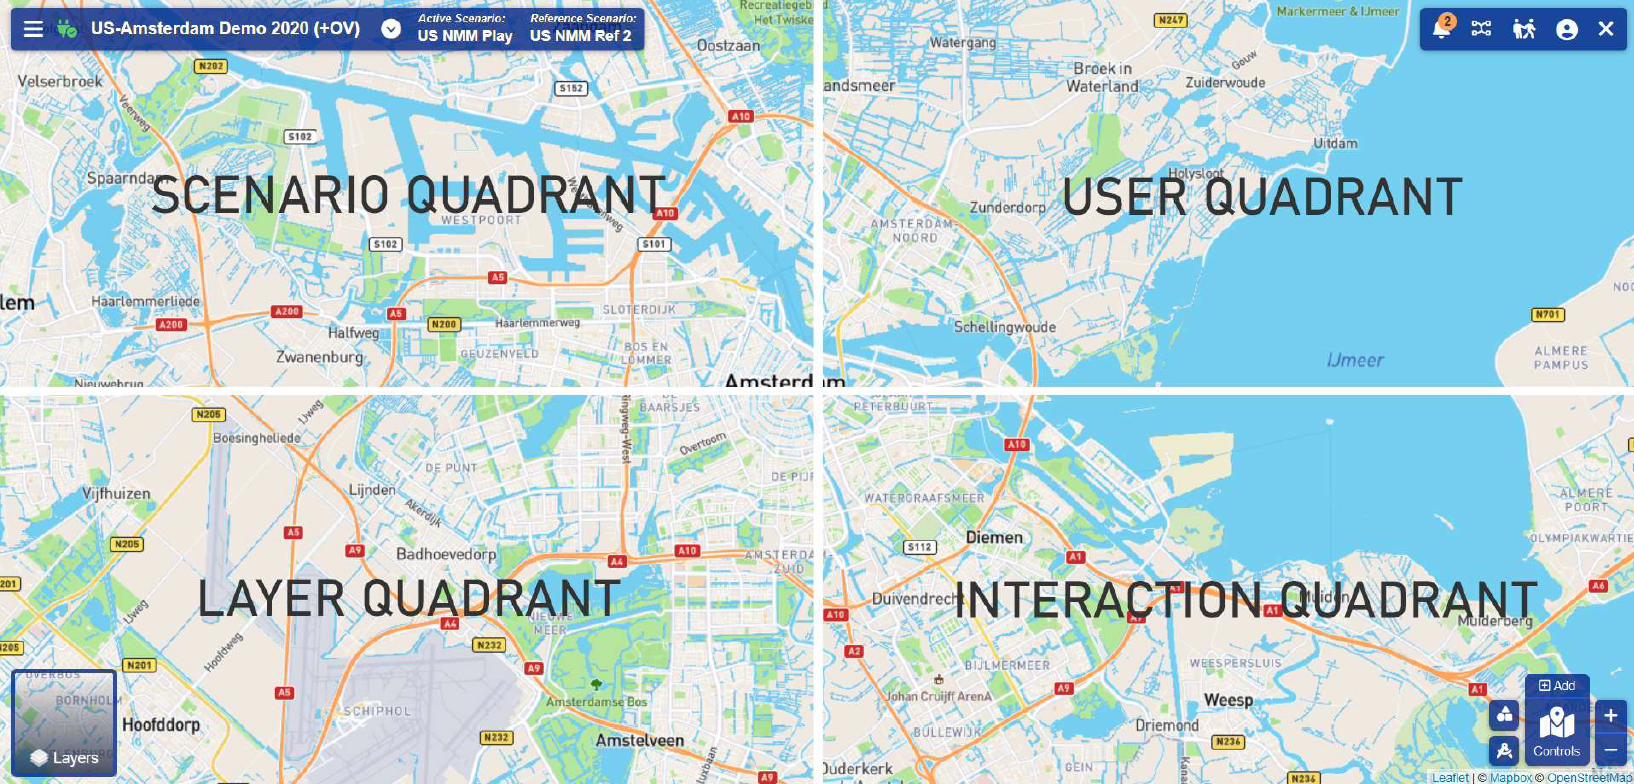 Figure 1: Quadrant Layout.
Getting Started
Accessing the Web Interface
The Web interface can be accessed with a (modern) web browser via the link below:
https://portal.urbanstrategy.nl/portal/
An account is required to open a project. Users can register, request a new password, or log in using the options in the top right corner of the header menu, as illustrated in Figure 2.
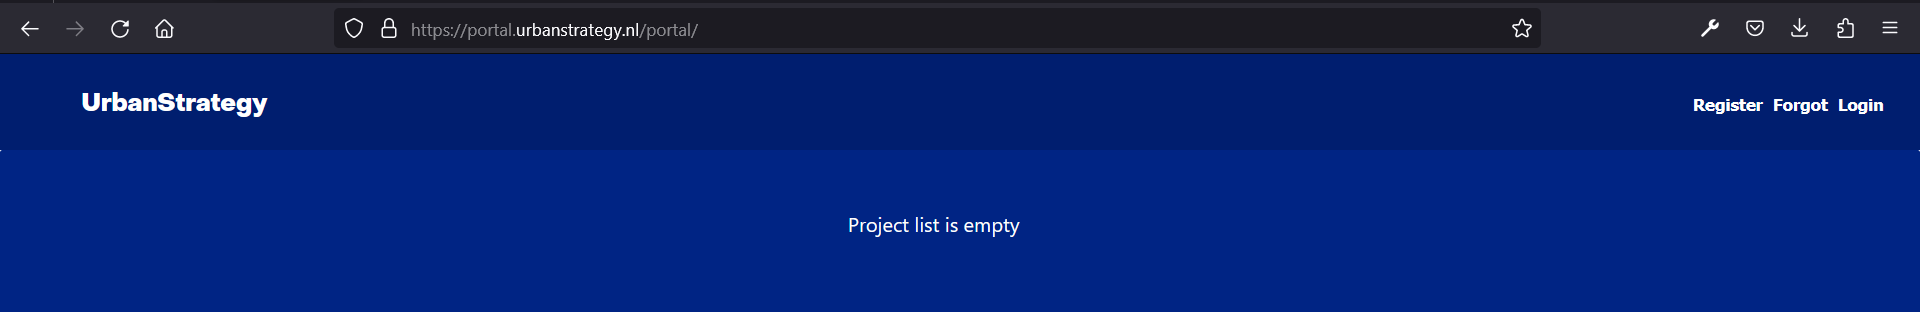 Figure 2: Portal without a valid account.
The registration process is composed of the following steps:
- Registration by new user via the Web Interface Portal
- Confirm data via e-mail
- Approval by administrator
After the account has been approved, the various installations will be visible in the portal, as illustrated in Figure 3.
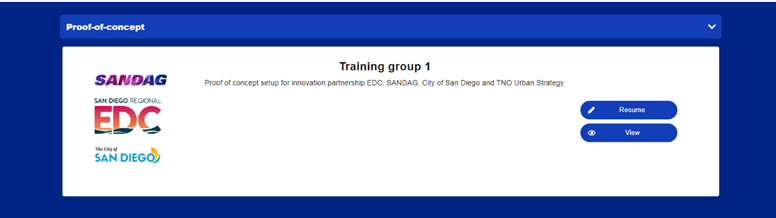 Figure 3: portal with logged in valid account.
The Web Interface has two modes: edit mode and view mode. The edit mode allows users to create scenarios and calculate interventions. In contrast, the view mode is limited to viewing results.
| Button | Action | Description |
|---|---|---|
 |
Edit Mode | There are no other users active on the Web interface. |
 |
Edit Mode | Another user is currently active on the Web interface. After selecting 'takeover', this user is placed in view mode. |
 |
View Mode | An unlimited number of users can use the Web interface in view mode. |
Elements in the Web Interface
| Reference | Icon | Explanation |
|---|---|---|
A |
Control Menu | |
B |
Connection Status | |
C |
Project Name | |
D |
Scenario Panel | |
E |
Name of the active scenario (selected from scenario panel) | |
F |
Name of the reference scenario (selected from scenario panel) | |
G |
Notifications | |
H |
Status of simulation models | |
I |
Lead & Follow | |
J |
User Profile | |
K |
Exit Web Interface | |
L |
Map and data layers | |
M |
Filters of map and data layers | |
N |
Planning Map | |
O |
Selection Tools | |
P |
Adding control (intervention) | |
Q |
Overview of controls (list of interventions) | |
R |
Zoom in | |
S |
Zoom out |
The meaning of the different elements presented in Figure 4 is as follows:
![]() Figure 4: Control panels available in the digital twin.
Figure 4: Control panels available in the digital twin.