Interaction Quadrant
The final quadrant is the Interaction Quadrant located in the bottom right hand side of the screen. This quadrant features components related to user map interactions and Controls.
Zoom
Starting from right to left, the first interaction component are the Zoom Buttons (See Figure 23). These allow the user to zoom in and out of the map by clicking on the + button to zoom in and the – button to zoom out.
 Figure 23: Zoom Controls.
Controls Window
The next major component of the Interaction Quadrant is the Controls Window (interventions). To access the window you will first need to click on the large button labelled Controls on the bottom right hand side of the screen as seen in Figure 24 below:
 Figure 24: Controls Button.
Controls List
After clicking on the button the Controls Window will become visible on the screen (Figure 25). The left hand side of the window contains a table with all the Controls (interventions) that users have added to the Scenario, while the right hand side houses buttons to set the visibility buttons for each Control Type on the map.
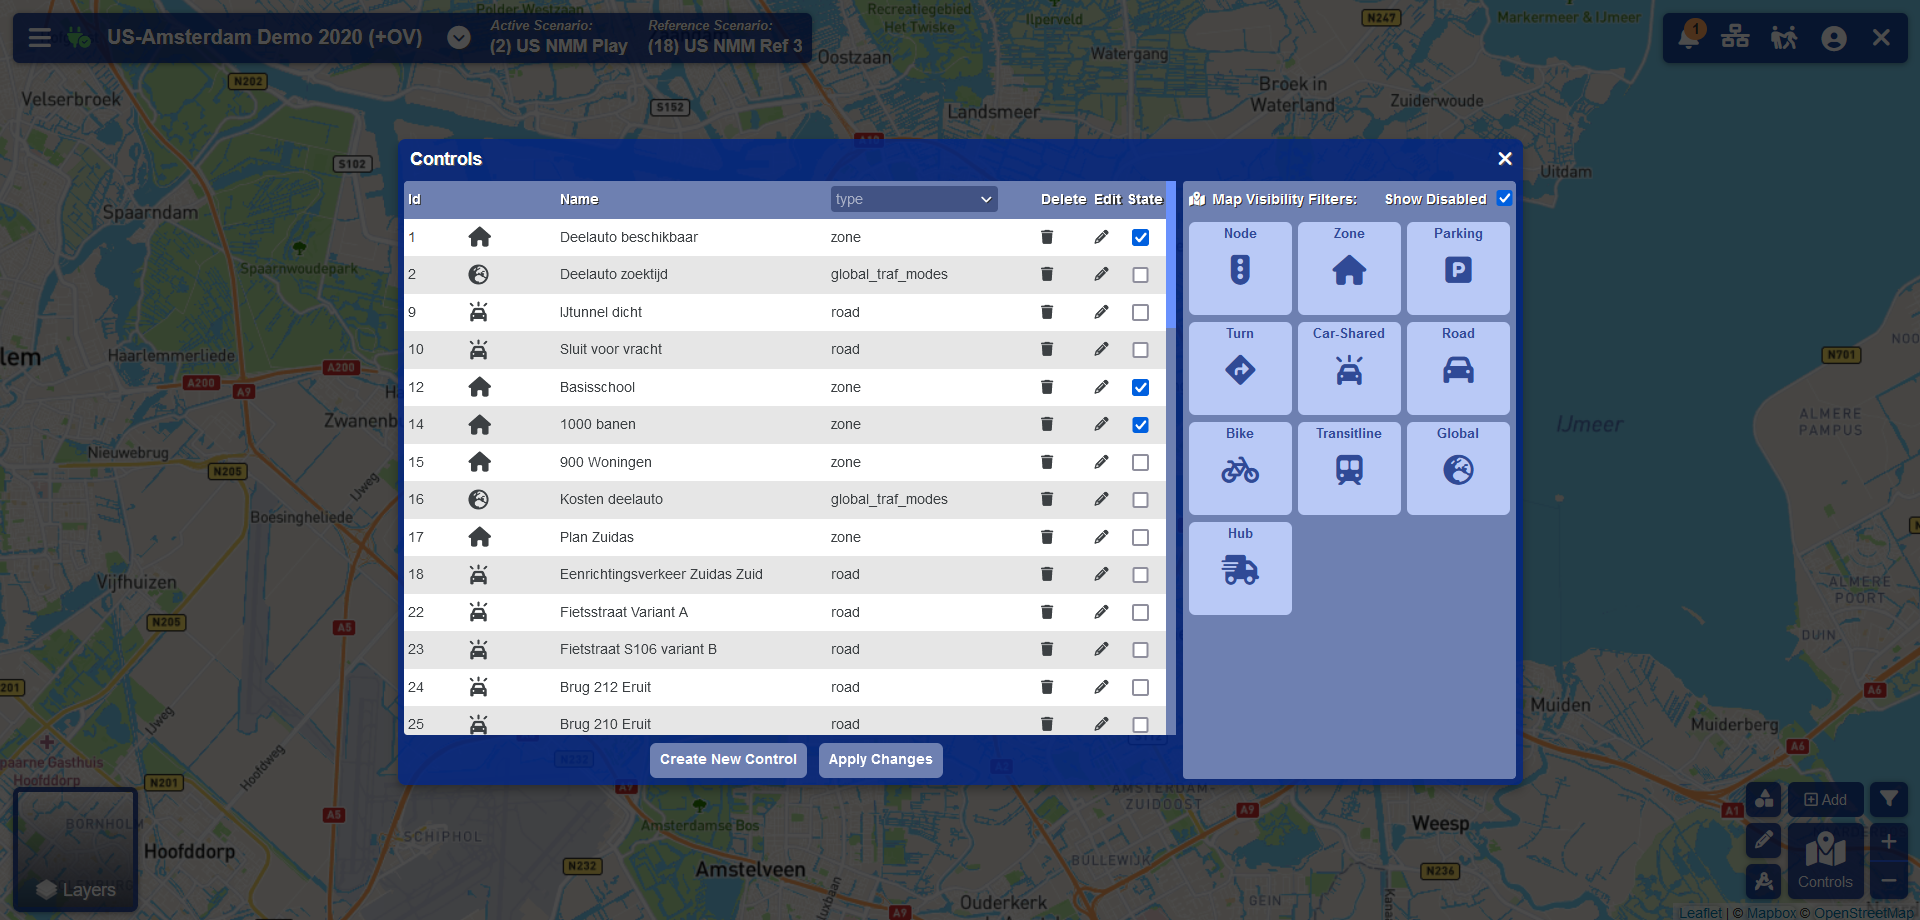 Figure 25: Controls Window.
*Note: This is a static window and cannot be resized.
Controls can be deleted and edited by clicking on the corresponding icon in the column on the row of the control you wish to perform the action on. You can also set a control as active or inactive by clicking on the checkbox in the State column.
Control Visibility
Clicking on the Map Visibility Filter Buttons will display the selected control types on the map with a marker (Figure 26). These marker will have an icon corresponding to the control type and will be highlighted if in the active state. You can hide the disabled controls by unchecking the 'show disabled' option in the visibility section.
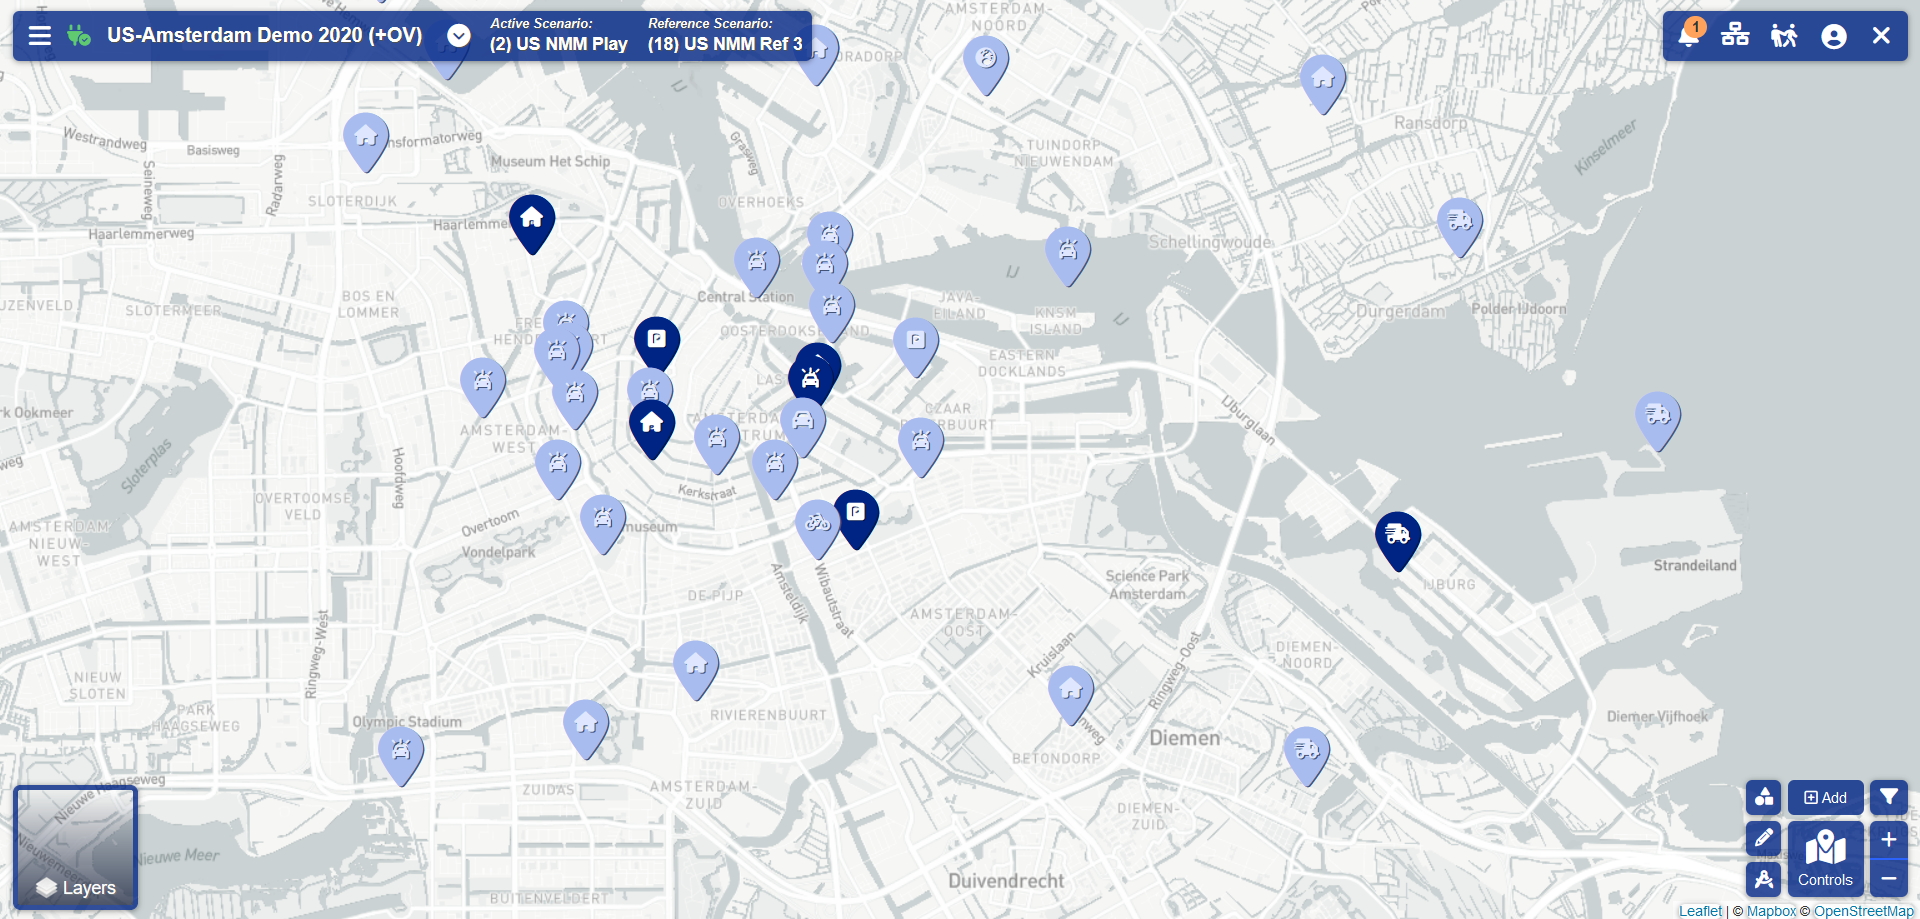 Figure 26: Control Markers.
Adding Controls
The Add Control Button (Figure 27) allows you to create a control for a selected object from one of the Basic Layers.
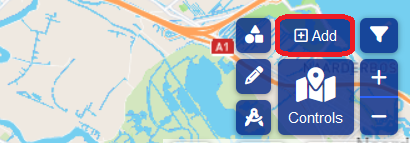 Figure 27: Add Control Button.
In order to add a control you will first need to select the basic layer for which you would like to create the control from the Layer Selector. You can then select the object you wish to make the control for on the map. You will then be prompted with the Control Subtypes window (Figure 28) from which you can select the desired control type. After selecting the control sub-type a new window will pop up containing the Control Details Form. Fill in the required form fields and click apply. If successful you will have added a new control to which can be viewed from the Controls Window in the next section.
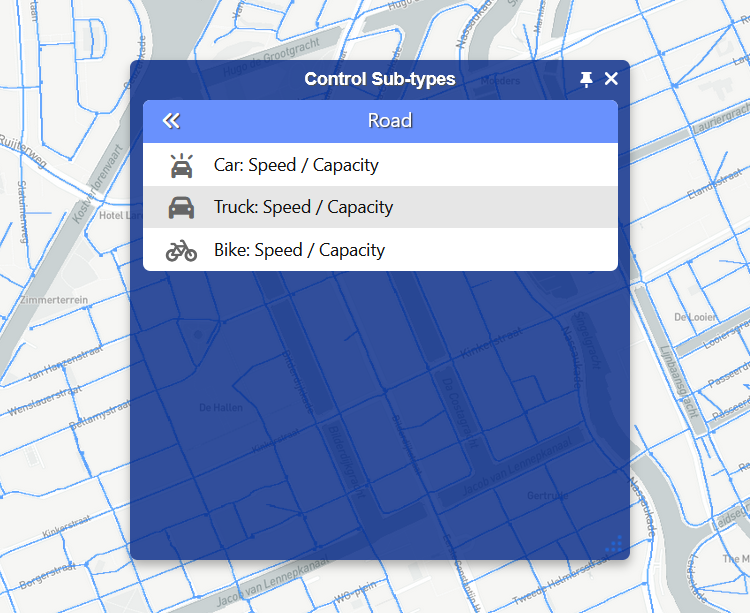 Figure 28: Selecting a Control Sub-type.
Planning Map
The next component of the Interaction Quadrant is the Planning Map. This feature can be accessed by clicking on the Planning Map Button on the bottom right hand side of the screen (Figure 29).
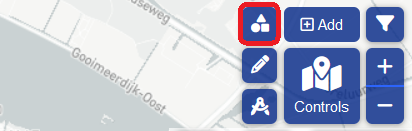 Figure 29: Planning Map Button.
Clicking in the Planning Map Button will open the Planning Map Panel on the top right hand side of the screen under the Profile Bar (See Figure 30). The Planning Map Panel has two main features:
- Planning Map Scenario Selection.
- Creating a Planning Map object.
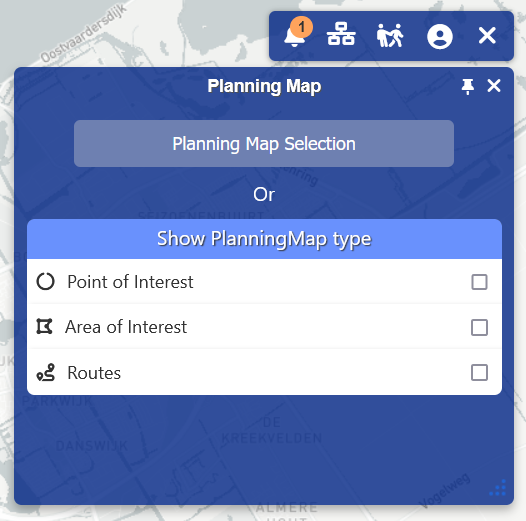 Figure 30: Planning Map Panel.
Scenario Selection
By clicking on the Planning Map Selection Button you will open an additional panel with a list of scenarios with check boxes next to them (Figure 31). By checking and unchecking the checkboxes for a specific scenario you can either show or hide Planning Map objects that have been created for those specific scenarios.
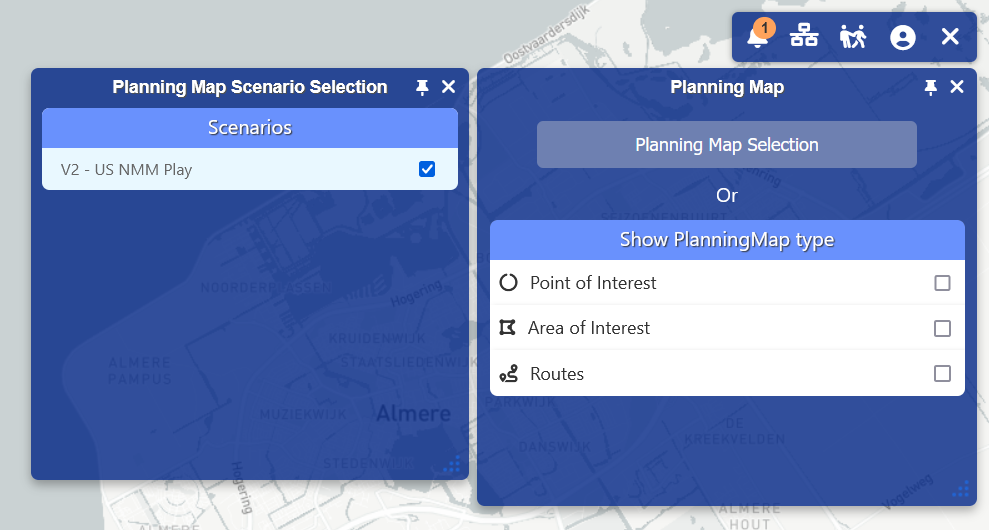 Figure 31: Planning Map Scenario Selection Panel.
Creating Planning Map Objects
There are three types of Planning Map objects you can create:
- Points of Interest
- Areas of Interest
- Routes
You can show or hide the tools for each of these types by clicking on the checkbox next to each category as seen in Figure 32.
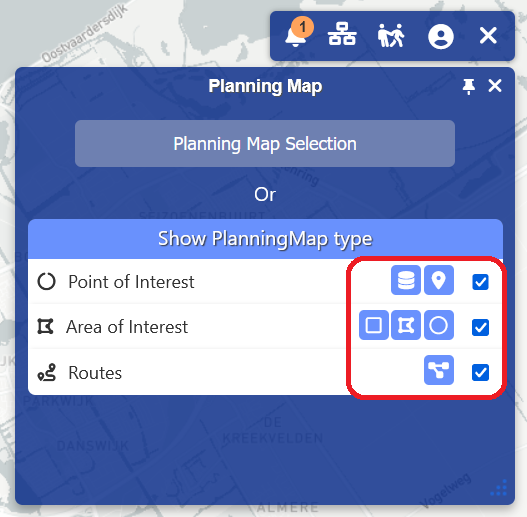 Figure 32: Planning Map Types & Tools.
A reference table of all the different tools can be seen here:
| Icon | Name | Description |
|---|---|---|
| Default Point of Interest | Create a marker from a default list of options that are provided. | |
| Custom Point of Interest | Create a marker from a customized list of options defined in the store. | |
| Rectangular Area of Interest | Create a rectangular Area of Interest. | |
| Circular Area of Interest | Create a circular Area of Interest. | |
| Polygon Area of Interest | Create a more complex polygon object by creating a joined set of points to draw the Area of Interest's shape. | |
| Route Polyline | Create a route using the polyline tool. | |
| Complete Shape | Will complete the polygon shape by connecting the first point with last drawn point. | |
| Undo | Will undo the last drawn point of shape of a polygon or polyline. | |
| Cancel | Will cancel the drawing operation. |
Points of Interest
When creating a Point of Interest you will be given two types of marker tools namely default and custom Points of Interest. After selecting the tool you can now create a marker by clicking on the location on the map where you wish to add the Planning Map object. After this a new panel will appear with some form fields for you to insert the properties of the new Point of Interest marker object you are creating (Figure 33).
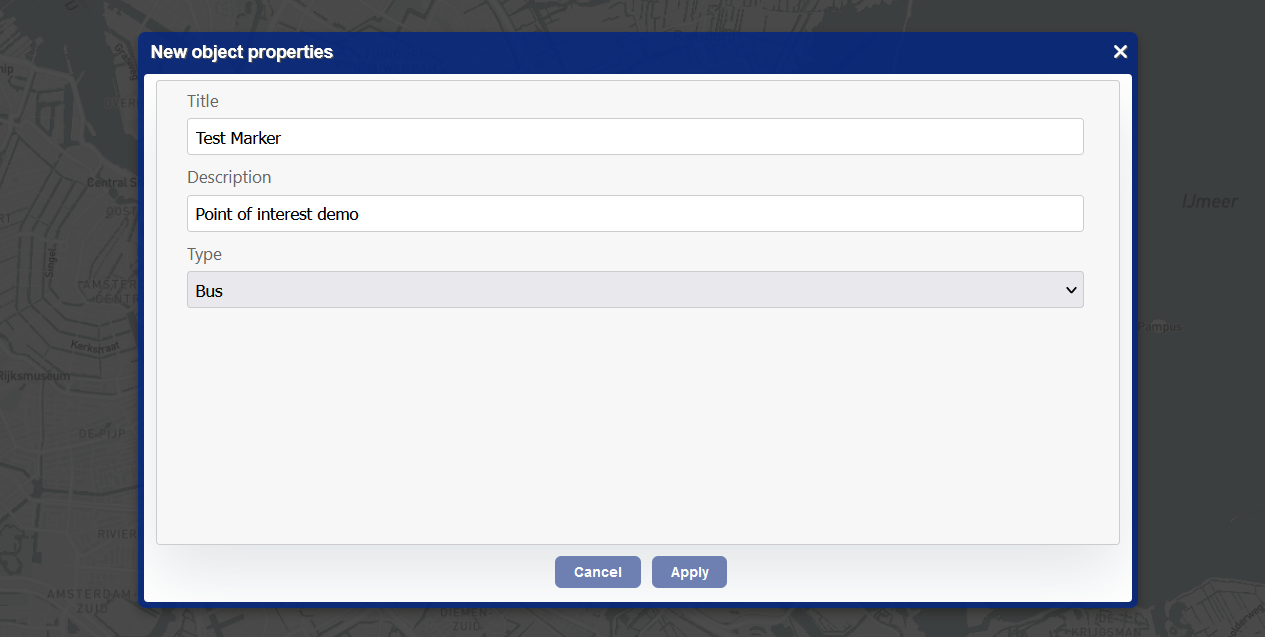 Figure 33: Planning Map Object Properties Panel.
Complete the fields and submit the form by clicking the Apply button. You will then see that a new marker will appear on the location that you clicked on the map as illustrated in Figure 34 below.
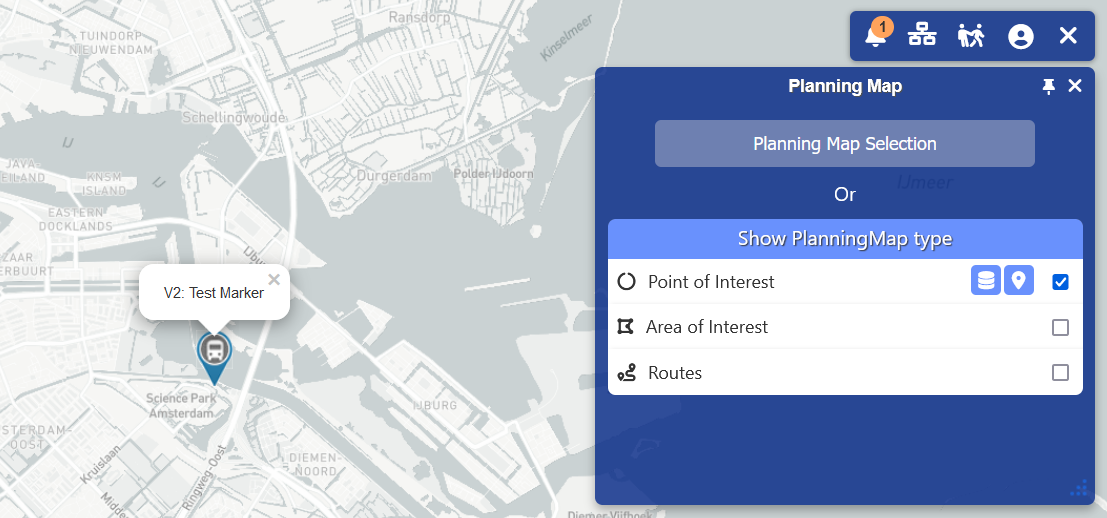 Figure 33: Planning Map Point of Interest.
Areas of Interest
The creation of Areas of Interest is similar to Points of Interest, however, instead of selecting a specific point you can instead demarcate an entire are using a rectangular, circular or polyline tool. Selecting one of these tools will allow you to draw the desired shape on the map. After you draw the shape a similar properties form panel will appear like it did in the Points of Interest creation. Fill in the properties and click submit to finish creating the area object. The new area object will then appear as illustrated in Figure 34.
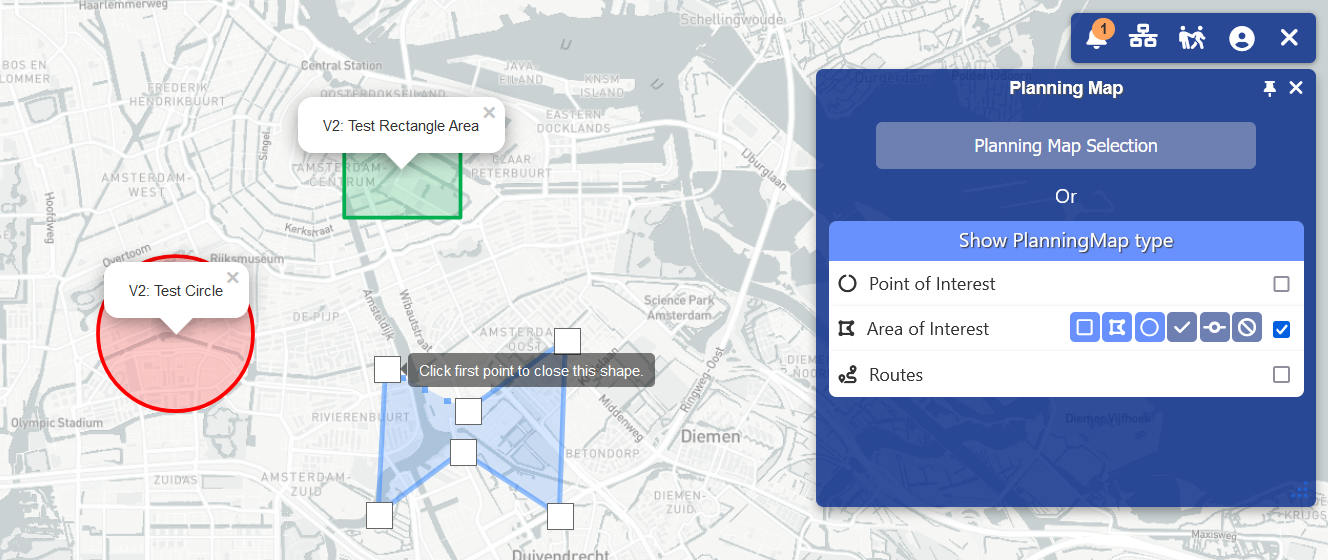 Figure 34: Planning Map Area Examples.
Creating a polygon area will have a few extra steps, you will need to plot points on the map to draw the desired shape of your polygon area as seen in Figure 34 above.
Routes
The last Planning Map object you can create are Routes. Routes use a polyline tool to plot the points of the shape that functions similarly to a polygon. By clicking on points on a map you can plot a route as seen in Figure 35. Click on the complete shape tool to finish the drawing and the properties form panel will once again be visible. Complete the form to finish the route creation.
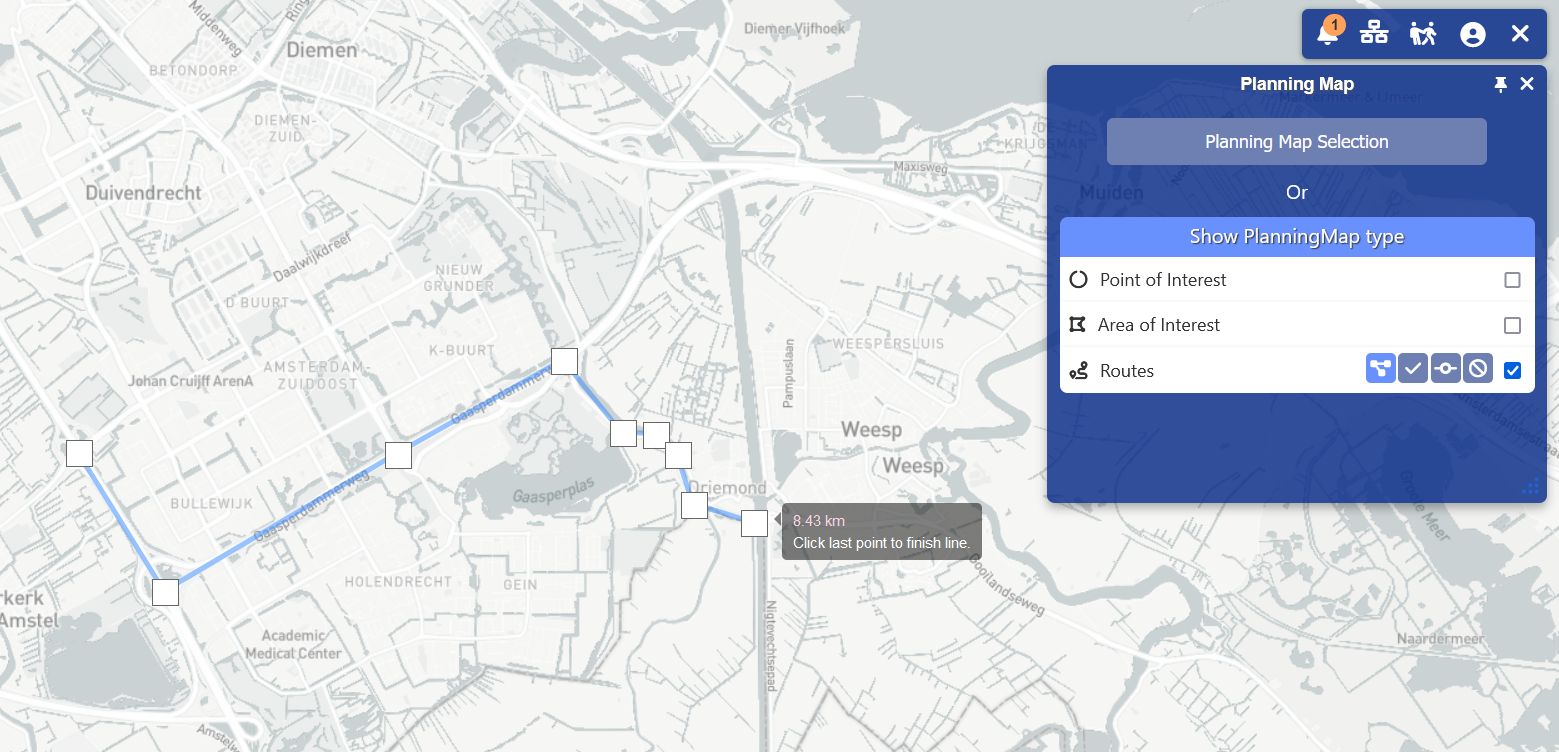 Figure 35: Plotting a route.
Layer Filters
The next component of the Interaction Quadrant is the Layer Filters section. Layer Filters can be applied to both Basic and Map Layers. These filters are defined in the back-end store and will only be available if a layer has a filter defined. To see if there are any filters available for a layer you will first need to select the layer you want to filter and then click on the Layer Filter button as illustrated in Figure 36.
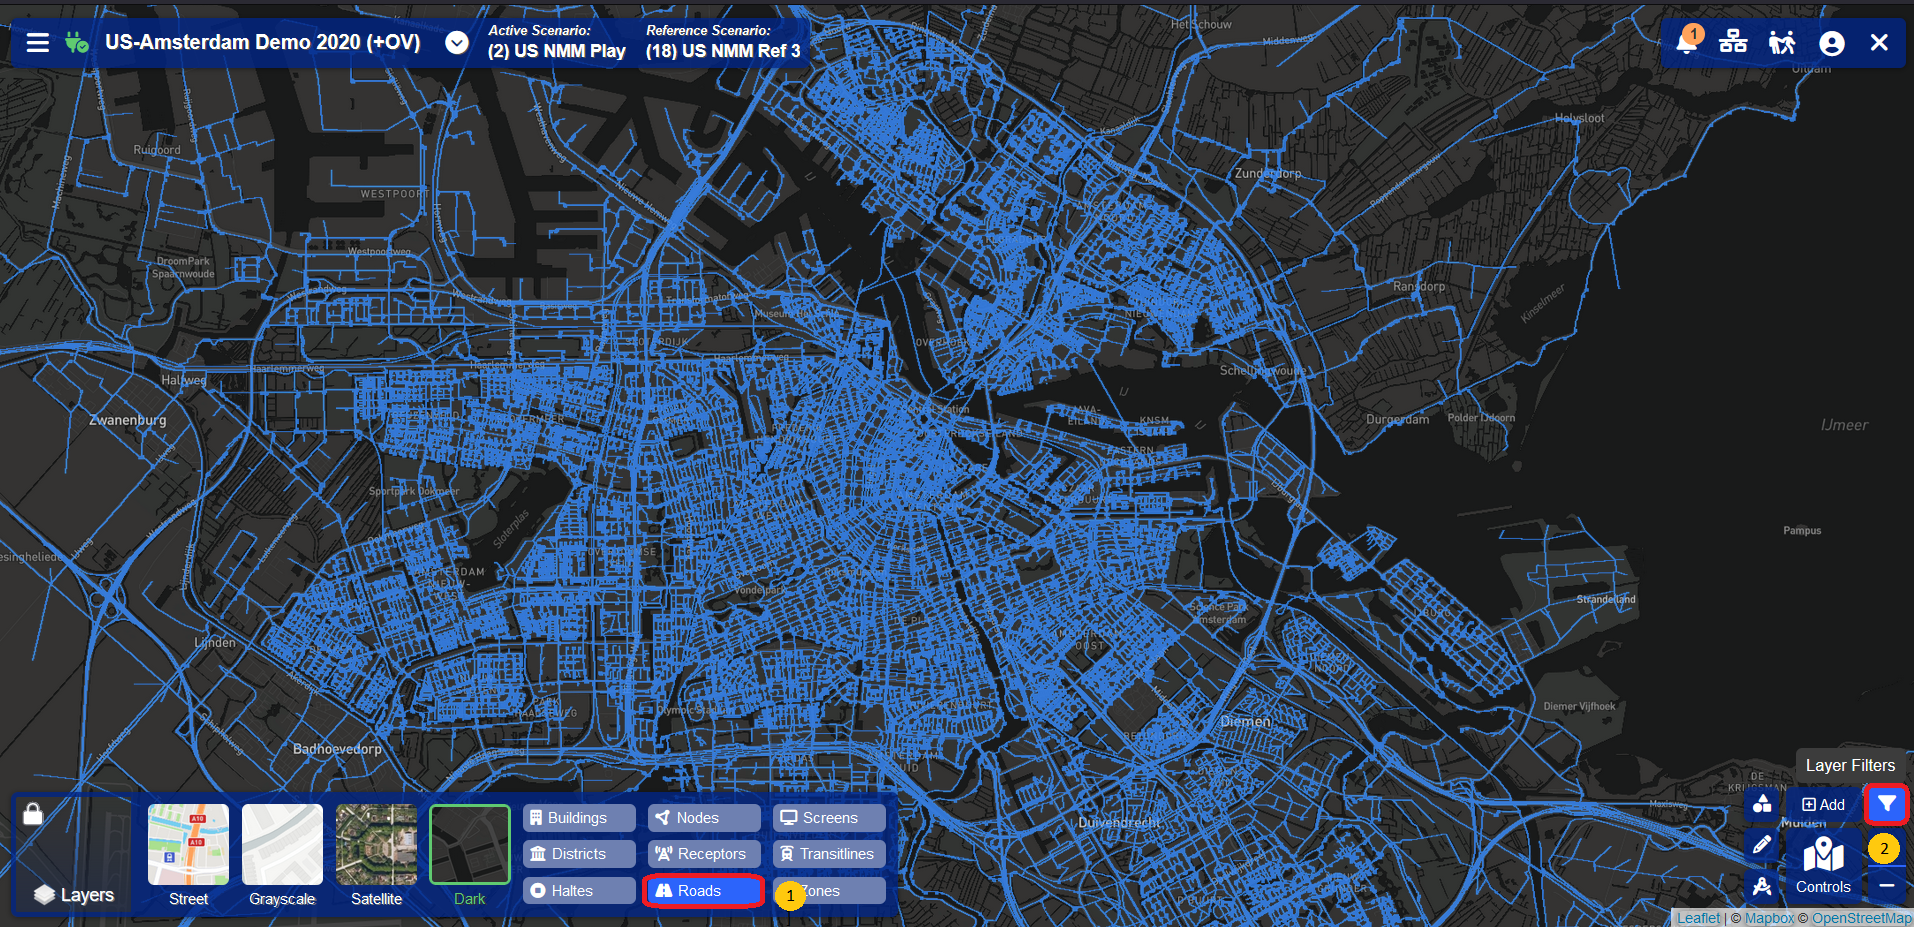 Figure 36: Viewing Layer Filters.
Next a panel will appear listing the possible filters you can apply to the layer. You can apply a filter to the layer by selecting the corresponding radio button next to the filters name. In Figure 37 below you can see a side-by-side comparison of the effects a filter has on a layer where the filter will hide all roads with capacity less than 2000.
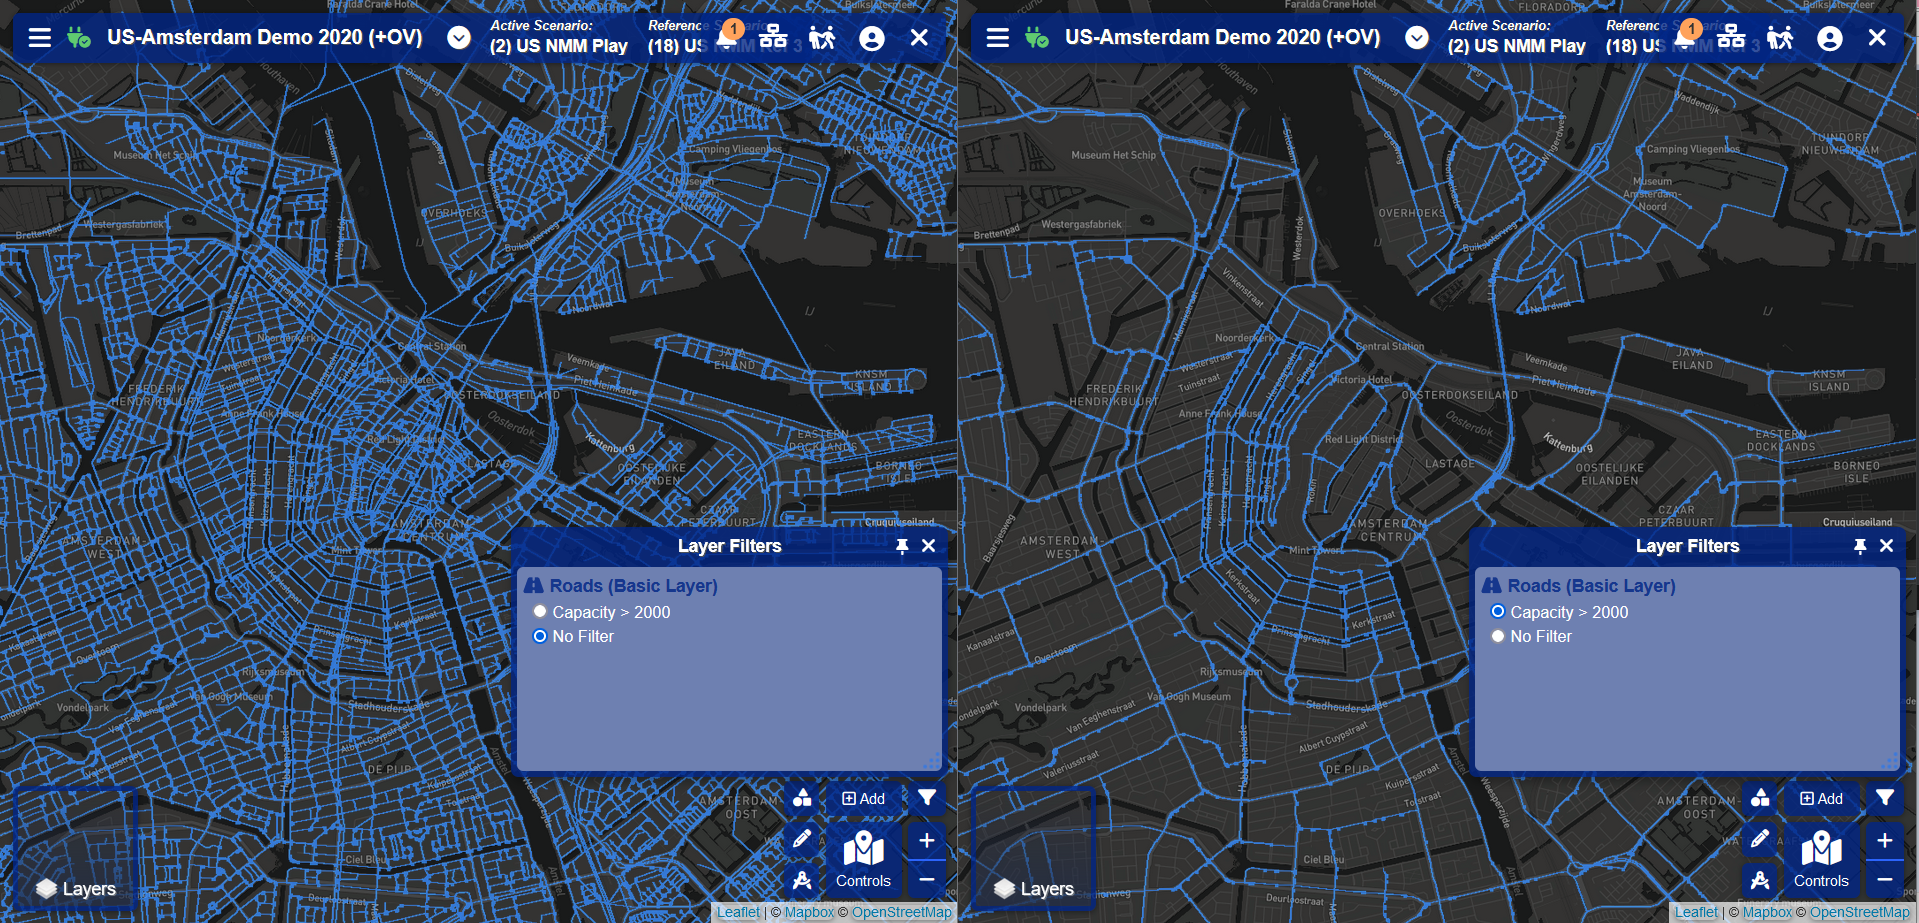 Figure 37: The Effects of Applying Filters to Layers.
Selection Tools
The next section of the Interaction Quadrant are the Selections Tools. These can be accessed by hovering the mouse over the Selection Tools Button (Figure 38). A small toolbar of buttons will shift out from the Selection Tools Button Containing selection options. You can also lock the panel in place by clicking on the Selection Tools Button.
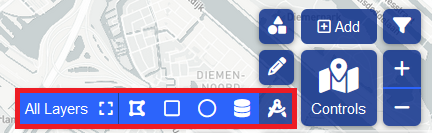 Figure 38: Selection Tools.
Specifying Selection Layers
Starting from the left hand side of the toolbar the first option you are presented is the layer selection tool. This tool allows you to specify which Basic Layer you wish to apply the selection to. By default, the 'All Layers' option will be selected, which means that the selection will apply to objects from all the Basic Layers. If you wish the selection to only apply to a specific layer, you can click on the button and pop out panel will appear with a list of Basic Layer options (Figure 39). You will only see layer options for layer that are visible on the map. Click on the applicable Basic Layer to prevent selection from occurring on any other layer.
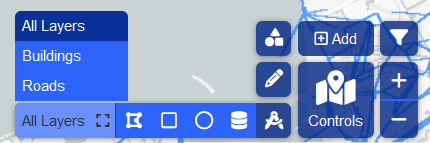 Figure 39: Specifying Selection Layer.
Polygon Selection
The next selection tool on the toolbar is the Polygon Selection Tool. Clicking this will allow you draw a polygon shape on the map to select Basic Layer objects (Figure 40). The Selection Toolbar will also be extended with new options. These include finishing the selection by connecting the first node to the last node of the polygon, deleting the last created node or cancelling the selection process.
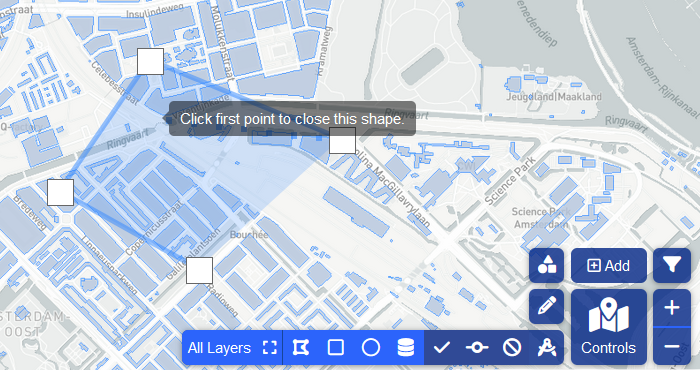 Figure 40: Polygon Selection in Action.
Rectangle Selection
The next selection tool is the Rectangle Selection Tool. This functions in a straight forward manner, clicking on it will allow you to draw a rectangle on the map and any Basic Layer objects within the bounds of the shape will be selected as seen in Figure 41 below:
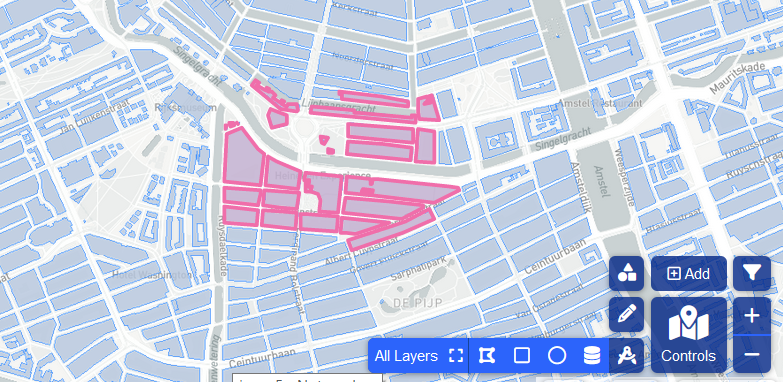 Figure 41: Rectangle Selection.
Circle Selection
Circle Selection functions exactly the same as the Rectangle Selection except that the shape of the selection is a circle.
Drawing Objects
A new tool for the Web Client is being developed to give users the ability to draw objects that correspond to various basic layer networks. The user can activate the tool by clicking on the highlighted button as seen in Figure 42. A toolbar will pop out with the various drawing tools available to the user.
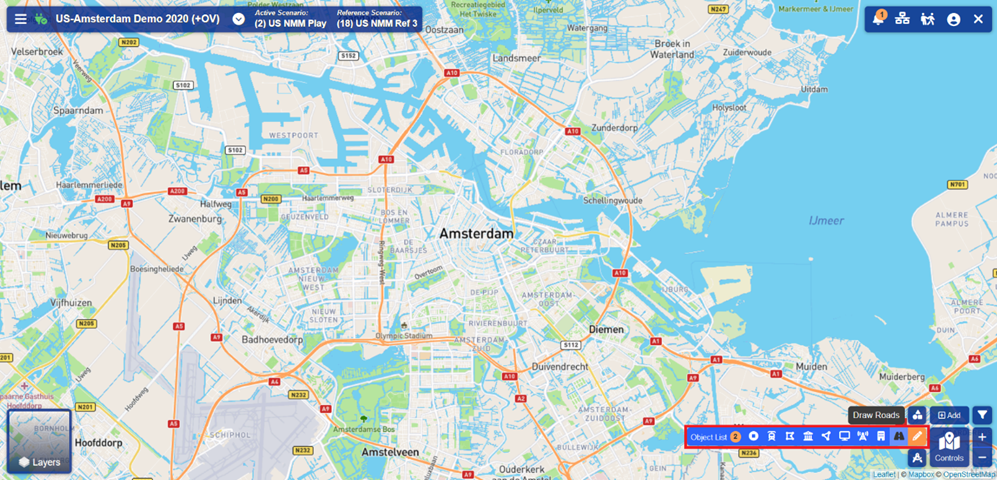 Figure 42: Drawing Toolbar.
How To Draw An Object
To draw an object, you need to select a tool from the toolbar corresponding to the type of object you wish to draw. The basic layers applicable to the object you selected will become active in order to assist you with the object drawing. You will be able to create and object by drawing the shape on the map. Each object type has its own shape, for instance a road will be a polyline while a building will be a polygon.
Example: Drawing a Road
In the case of drawing more complex objects such as roads, the user interface will assist you by automatically snapping to the closest node to where you clicked. You can then complete the road by clicking near the endpoint node as seen below in Figure 43:
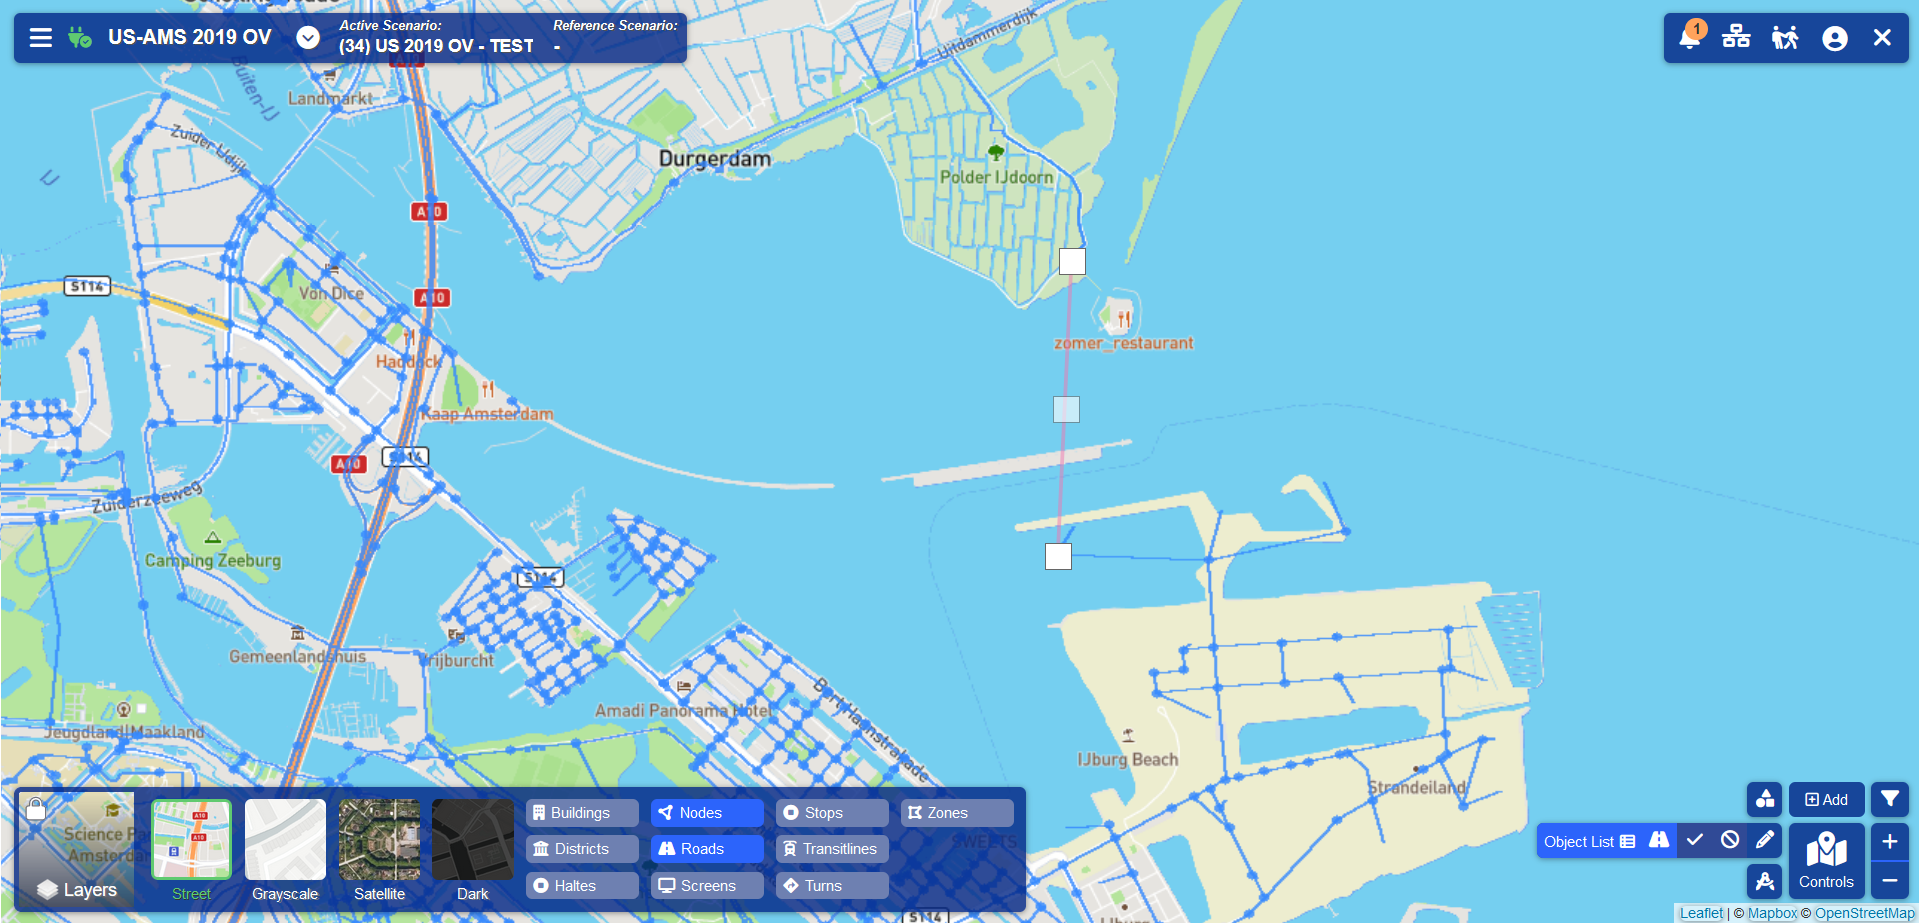 Figure 43: Snapping Roads to Nodes.
Now that you have set the start and end point of your road, you can now modify the roads shape (such as adding curves) by clicking on and dragging the nodes between your roads start and end point (See Figure 44 below).
 Figure 44: Adding Curves to Roads.
Once you have completed the shape of your road you can click on the tick icon on the Drawing Toolbar to finalize the drawing and move on to the next step.
Adding Properties
Once the drawing is completed you will be prompted with a new panel window displaying a form with properties for the new object which you have just created (Figure 45). You can now add the properties of the new object by completing the form. In some cases, such as road objects, some of the properties will have defaulted values (selected from connecting roads) in order to assist you with completing the form. Once you have added the properties you require you can submit the form to complete the object drawing.
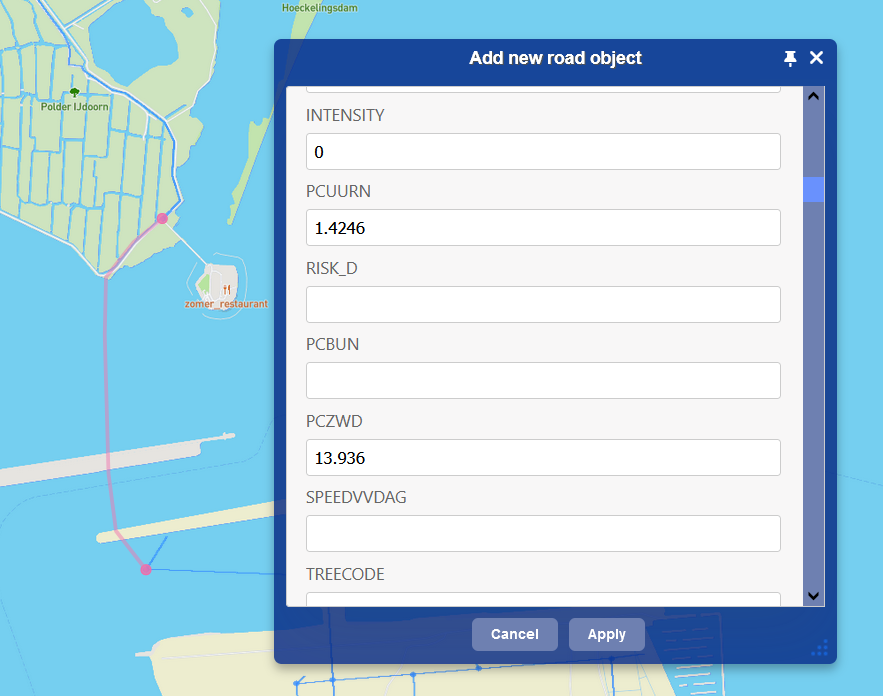 Figure 45: Drawing Properties.
Special Case: Dimensions
Some objects, such as roads, will have an extra layer of complexity, namely dimensions. Dimensions are required on layers such as road layers to differentiate between different modes of transport. The properties form has checkboxes (Figure 46) that will enable you to tick which dimensions this object will be visible on and whether the road will factor into the model calculations for a specific dimension. To assist the users the web interface will automatically tick the object to be visible on the default dimensions. When an object is initially created it will apply the properties specified in the form to all the dimensions ticked. In order to save properties to a specific dimension you will need to edit the object from the Drawing List. This process will be discussed further in the documentation.
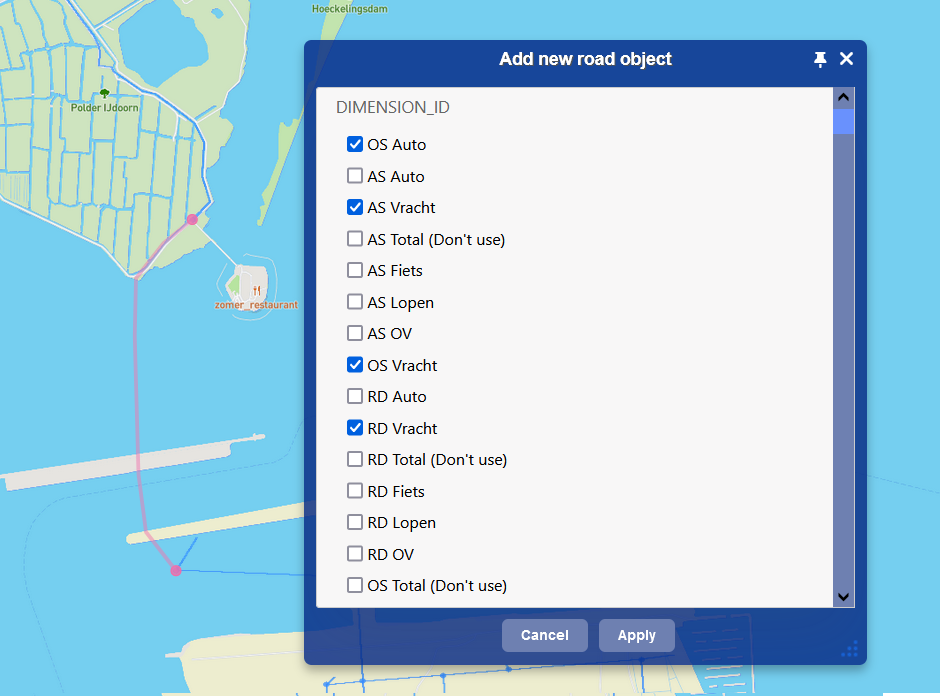 Figure 46: Dimension Selection.
Drawing List
After the user has drawn the object, it will not immediately be applied to the basic layer network because any data changes to these objects in the store will trigger the models to recalculate. Instead, the newly added object will be added to a staged list of changes that will be sent to the back end all at once when the user has completed all drawing operations. This is done so that it will have a minimal impact on model computations.
The user can see a list of all user drawn objects by clicking on the 'Object List' button on the Drawing Toolbar. This button will also show a count of all the staged changes that need to be applied as seen in Figure 47 below:
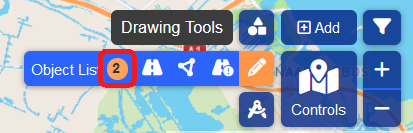 Figure 47: Staged Changes Count.
Once you click on the 'Object List' button a window panel will become visible displaying a list of all the user created objects using the drawing tools (Figure 48).
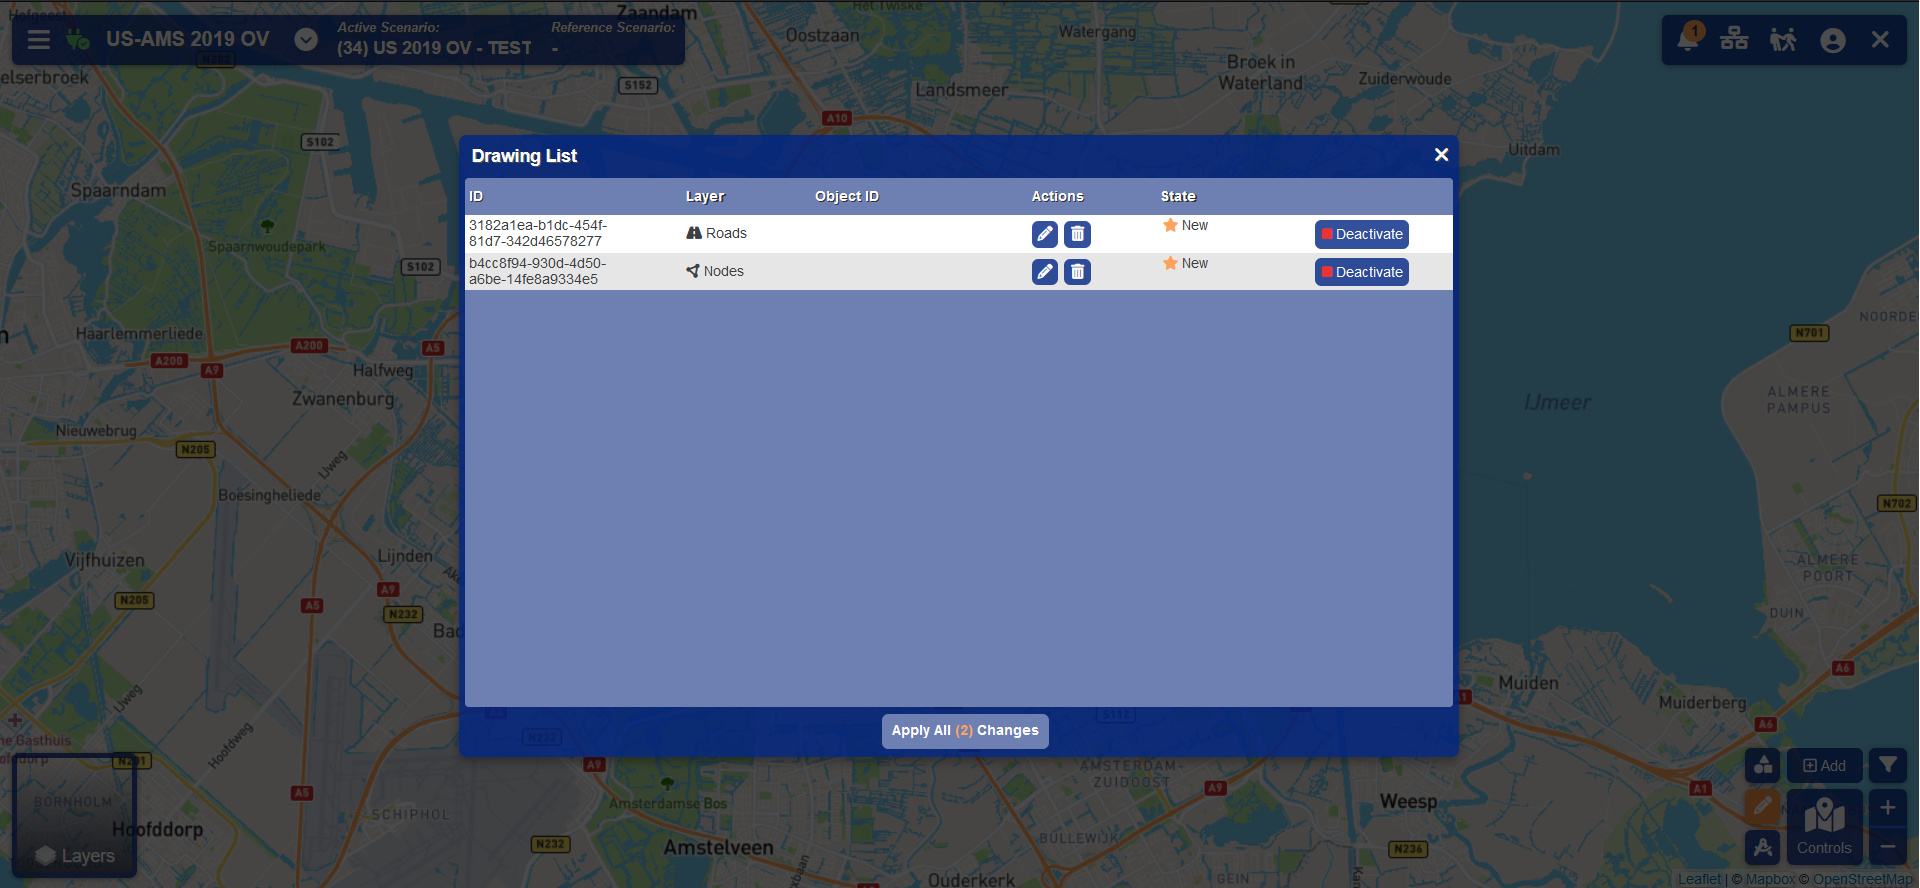 Figure 48: Drawing List.
From here the user will be able to perform the following functions:
- Edit: Edit the shape, location and properties of the object.
- Delete: Completely remove the object.
- Change State: Set the object as active or inactive for model calculations.
Once the user has finished all necessary additions or changes to the objects, they can then click on the ‘Apply All Changes’ button. This will then collate and send the changes to the back end and the models will then be able to start their calculations with the newly added objects where applicable.
In the table below you can see a list of all the different actions with descriptions the user can do within the Drawing List window:
| Button | Action | Description |
|---|---|---|
| Edit Drawing | Edits the shape and properties of a drawn object. | |
| Delete Drawing | Completely remove a drawn object | |
 |
Activate Drawing | Activate a drawn object for model calculations. |
 |
Deactivate Drawing | Deactivate a drawn object for model calculations, but do not delete the drawing. |
 |
Restore Drawing | Restore a deleted drawing before the staged deletion is committed. |
 |
Dependents | This means that the drawn object has other drawn objects that depend on its existence, therefore you cannot edit or delete the object until the dependents have been removed. |
Editing a drawing
In order to edit a drawing you need to click on the pencil icon on the line applicable to the object you wish to edit. The interface will automatically focus on the area of the map where your object is located and highlight it for you. You will now first have the ability to edit the shape and location of the object. In the case of special objects, such as roads, you will be able to edit the shape but not the location of the start and end node.
After editing the shape and clicking on the tick icon on the Drawing Toolbar, the properties form will pop up and you will once again be able to modify the properties of the object. Once done you can submit the form and the object editing process will be complete and the changes to the object will be staged for update. Note that if you have edited an active object, the changes will not apply to the models until you click on the 'Apply all changes' button in the Drawing List.
Editing objects with dimensions:
Objects that have dimensions applicable have an extra step when being edited. When you click on the edit icon a small panel will appear with options for you to select which dimension you wish to edit (See Figure 49). When you change the properties of the object on the properties form they will only apply to the dimension you selected when first starting the editing process.
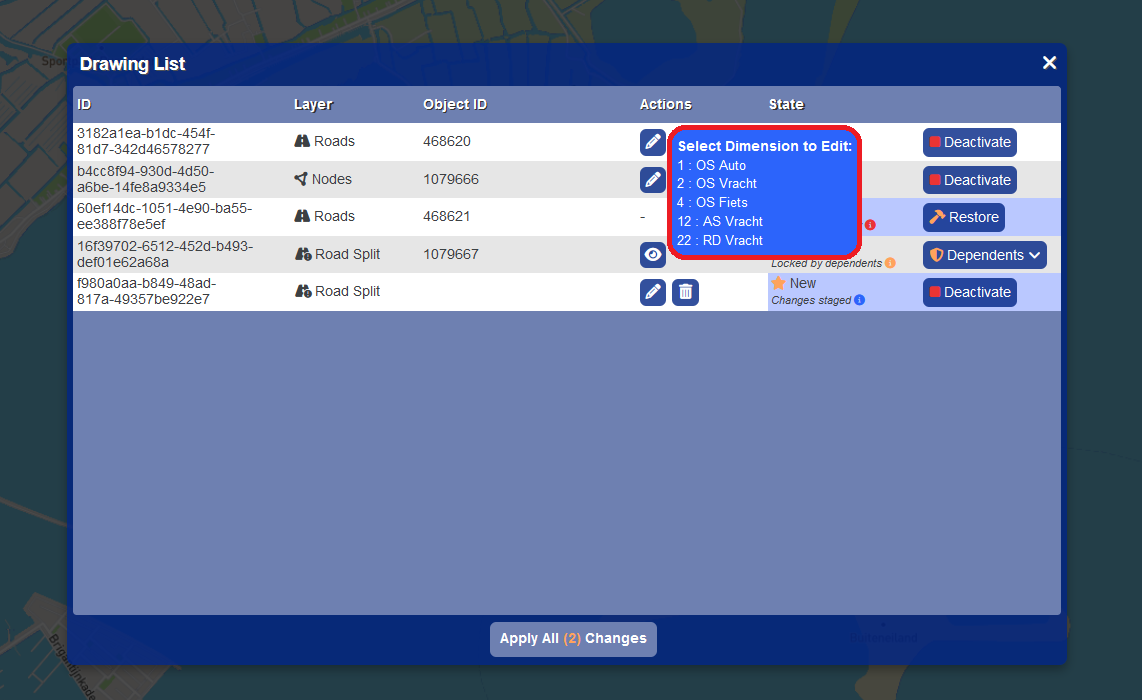 Figure 49: Selecting A Dimension To Edit.
Deleting a drawing
In order to delete a drawing you can click on the trash icon on the corresponding row in the Drawing List. Clicking on the icon will stage the drawing for deletion in the store. You can restore drawing before it is deleted by clicking on the restore button in the last column in the table. It is important to note that once you have clicked on the 'Apply all changes' button on the list panel, the drawing will be permanently deleted and you will no longer be able to restore the drawing.
Dependencies
In some cases you may want to create a drawing that is connected to another previously drawn object you created. In these cases the new drawing will become a dependent to the older drawing it is attached to. For example, you could create a new node object and then attach a new road object as a end point node. This means that the existence of the new road is dependent on the existence of the node you created earlier. Objects that have dependents cannot be edited or deleted until the dependent is first deleted in order to preserve integrity.
Splitting Roads
A special type of drawing was added to the interface to allow you as the user to split existing roads. To do this you need to click on the split road icon on the drawing toolbar (Figure 50).
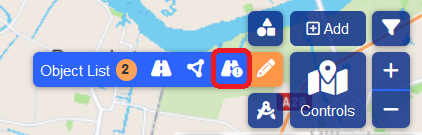 Figure 50: Split Road Tool.
Once you have selected the split road tool the roads and nodes basic layers will become visible. You can now use the crosshair mouse cursor to click on the point at which you wish to split the road. In order to assist you, the interface will automatically snap to the nearest point along the roads line from where you clicked. This means that you do not have to worry about being perfectly accurate when trying to click on the roads line.
After the split point has been determined the interface will create a marker on the point where the split will take place and create a new node there. You will also see a yellow and green line along the path of the road which depict the two new roads that will be created from the split (Illustrated in Figure 51). You can still change the location of the split by dragging the marker to another point along the roads line.
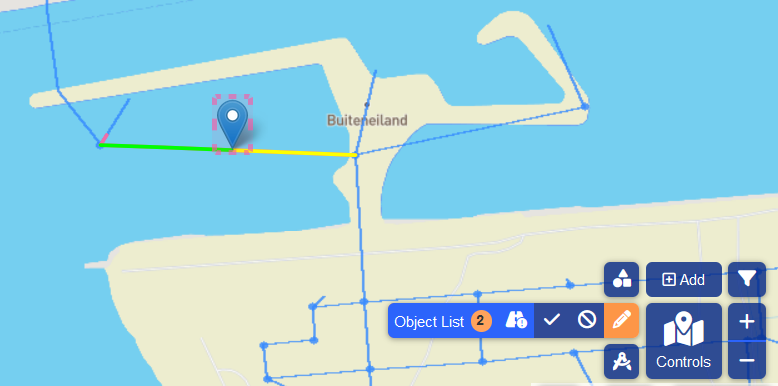 Figure 51: Splitting A Road.
Once you are satisfied with the location of the split you can complete the drawing by clicking on the tick icon on the Drawing Toolbar. You will then be prompted with inserting properties for the new node that you are creating on the split point. You will not need to add properties to the two new roads since they will inherit the properties of the original road that was split, as well as which dimensions the new roads will appear on.
It is important to note that once the road split is committed to the store the original road will be archived and the two new roads will be added to the store. If the road split is subsequently deleted, the original road will be restored.