How to load buildings layer in QGIS
In Urban Strategy, noise propagation from traffic is calculated by the Noise model and translated to a max_LDEN value per building by the Buildings indicators model. This guide describes how to load the buildings layer and visualize the max_LDEN values, using QGIS. The resulting layer can be used for reporting, visualization, or further analysis.
Time required: about 10 minutes
Prerequisites: the QGIS Connector plugin and an approved account with REST API access.
Learning objectives
- How to load the buildings collection from Urban Strategy into QGIS
- How to interpret and adjust the resulting data layer for your own setup
Step 1: Connect QGIS to Urban Strategy
Connect QGIS to Urban Strategy as described in the QGIS Connector tutorial.
Step 2: Load the buildings collection into QGIS
-
In the QGIS browser panel, expand the relevant project and open the scenario for which you want to configure the 24-hour intensities.
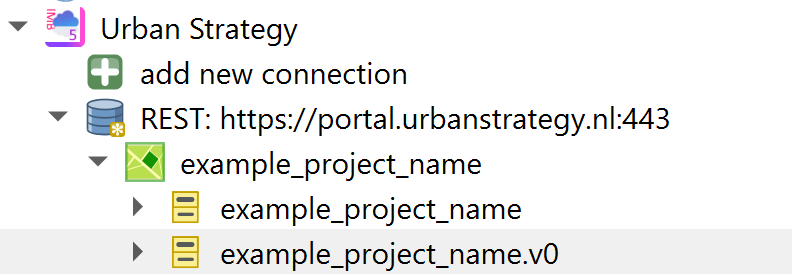
-
Double click the
 collection to load it as a new layer into QGIS.
Rename or unlink the layer (optional)
To prevent unintended overwrites of the Urban Strategy data collection, you can rename the layer or unlink it by right-clicking on the layer and choosing Urban Strategy > Unlink.
-
With the new layer selected, open the QGIS attribute table
 to inspect its properties. The layer contains, among others, the following columns:
Column name Description DISTRICT_ID Points to the object_idin thedistrictscollection.FUNCTIONCODE If the building is considered a sensitive building in terms of noise legislation, 1 = true 2 = false. GEBHOOGTE The height of the building in meters INHABIT The number of inhabitants MAX_I_LDEN The maximum Lden value on the building. MAX_NO2 The maximum NO2 value on the building. OBJECT_ID Unique identifier for the dimension
Step 3: Format the building layer based on your objective
Using the QGIS layer properties, the layer symbology can be formatted to match your analysis or reporting needs. For example, you can apply graduated colors based on the MAX_I_LDEN values to quickly identify buildings with higher noise exposure, or create filters to focus on specific districts or building types.